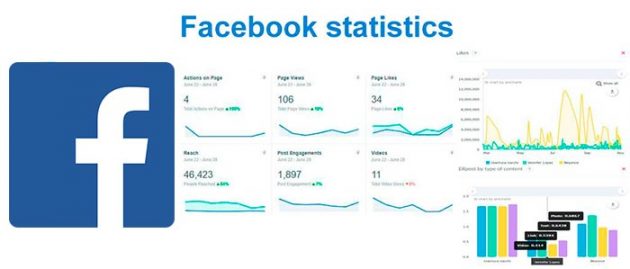
Facebook statistics of any account – best free ways to view stats
Evaluating the work on Facebook, we often pay attention to the number of page subscribers and the number of likes of the posts. However, it is necessary to focus not only on these external parameters, but you should seriously study the Facebook statistics. This will help to determine which posts and at what time were most relevant. Also, Facebook page statistics will point to a number of other indicators that will help you to promote with maximum impact.
There are lots of ways to make your analysis, but I’d want you to follow by best experience and to use Popsters application that analyze the Facebook pages (and do that for another 9 social networks as well), help to compare it with competitors and give you the most capacious information for improving interactions with subscribers.
How to view Facebook statistics
The most suitable and convenient tools among the others (with their functional and cost) are:
- popsters.com (allows you to analyze any Fb pages);
- Facebook Insights.
https://popsters.com is very convenient and intuitive. It is too long to enumerate all things that this tool is able to do.
Therefore, I will describe in brief.
It is useful if you want:
- to see the most popular publications of different accounts and groups (for the selected period);
- to sort posts by likes, reposts, comments, ER;
- to sort by content of the publications – photo, video, text, animation (to learn the most popular ones and among others);
- to compare indicators of several groups in graphical form at the same time;
- to make a global search for the best posts on Facebook by phrase, hashtag or word (with sorting and filtering);
- to add favorite publications to Favorites, creating various lists;
- to look at numerical indicators of groups for the selected period (real number of subscribers, average ER of post / group per day, number of comments, etc.);
- to study the textual materials in groups with the help of Text referring;
- to export statistics to Excel (xlsx), pptx, pdf;
- more than 20 other useful metricks;
- And so on and so on.
Using it you can look at the dynamics of development of both your groups and others, to study which publications are “viral” and the most commented, to transfer experience and improve the performance of your own groups.
Bonus. At the end of this article you will find interesting statistics about Facebook, which may be useful for a marketer..
Popsters – quick manual
So. What you should do is to follow the link https://popsters.com and start overviewing.
1) Log in.
Click on an icon with Facebook and then enter your login and password, which you usually use while entering Facebook.

2) Choose what is to be analyzed.
There are few variants. You can put into the line a name or address of account, URL or hashtag.
You can copy them from Facebook and put them into the address bar one by one, then press the button “FIND” and press the PLUS.
3) Choose the period and download all the publications.
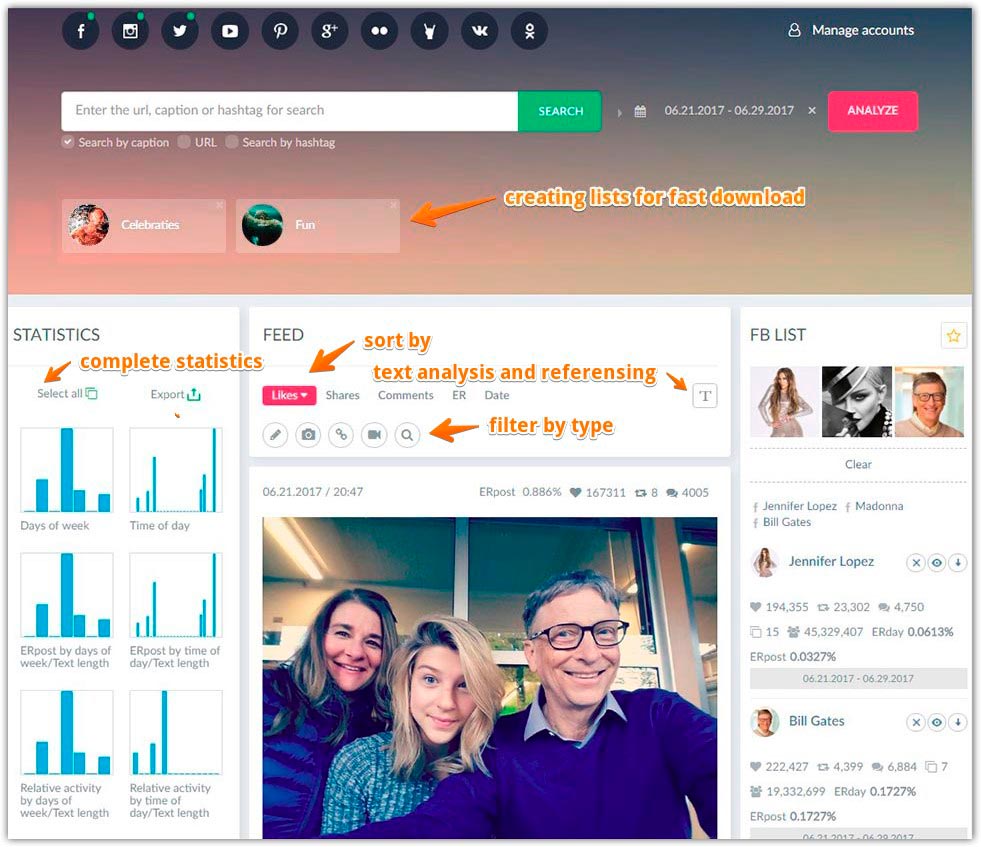
4) What first comes up is FEED. In this area you will find all the post of our chosen accounts one under the other. In the beginning of the work all of them are sorted by likes.
Here are a number of different sortings and filters to make our work with Facebook statistics more comfortable and fast. It is important to understand how to use them.
If you want to range the posts by the amount of likes, comments, ER (engagement rate) or the date you just have to press the button ones or twice. It depends on which exact effect is needed.
You can use filters in the same way too. You can switch them ON or OFF or just ignore them at all.
One more useful thing here is the filter by phrases or words. So if you enter the word WAY you will we see in the FEED only those posts where this word is used.
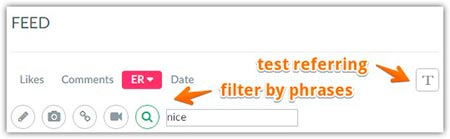
Also the new feature was added. It is Text referring. To start analyze press the button with letter “T”. On the left side two new charts have appeared: “Words” and “Words according to ER”. While clicking on any word on these graphics we will see all the publications which include this word. And we can apply all the sortings and filters to these posts.
What else attracts attention? Above picture we see the date and time of posting, then how many Likes, Comments it won and what is the value of ER of this post.
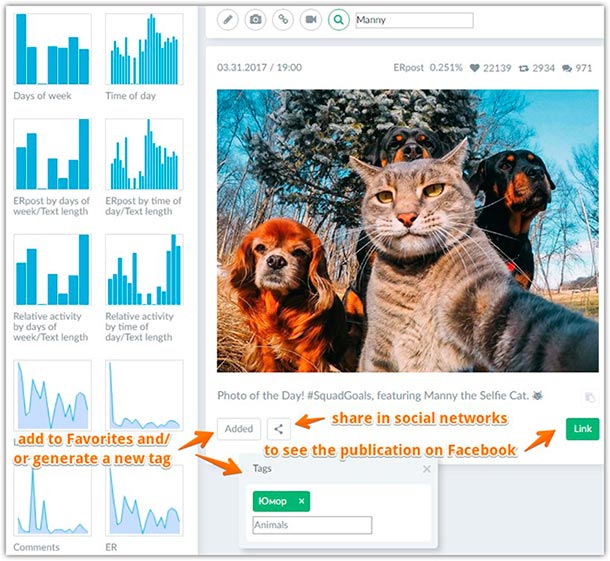
Clicking on the picture or the video we can see it in the best quality. And if you want to see the publication on Facebook you can press the button LINK.
And you can also share the post with your friends in different social networks.
5) You can add the post to your favorites. And, in the process, choose the preferred TAG. You only have to press the needed button.
And of course, you can make new tags.
6) On the right side is one more interesting block. Here we can manage our batch loading unit.
We can clear the list of accounts. We can delete them selectively. We can rename the list.
And if the list was created just now, we can save it for the next usage by pressing the STAR.
Also we can go directly to Facebook accounts from this list just clicking on its names.
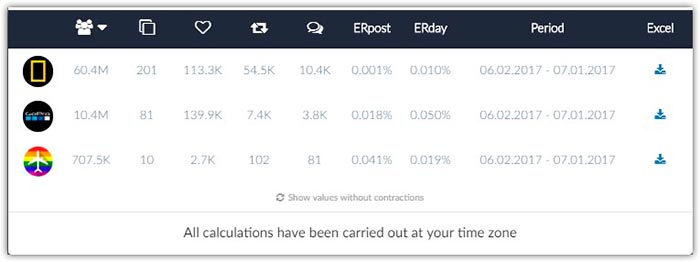
Below we see the short statistics of all this accounts. And yet there are three buttons here to clear, to hide or to export the information into different formats.

7) Short table with info for analyze
After all this you can generate a short comparative table with the same information pressing the button “Show table” (photo above).
Tab “common”:

Tab “compare”:
And you can also export the data about any account into Excel.
This article may be helpful too:
How to find the most liked post on Facebook on any profiles.
Detailed Facebook page statistics and analysis
Facebook stats – a big block with various graphics
Look at the left side of the screen. Here is the block with a big number of different graphics. You can select all of them or explore each of them separately, pressing a small picture. Also you can export the info into different formats too.
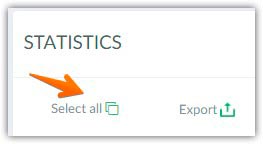
Pressing “Select all” you will see the list of charts instead of FEED. The FEED is moved under all the graphics.
Here you can change the time period by moving the slider.
You can download, save, annotate or print the charts.
Every account has its color for comparison.
The publications from the downloaded accounts are compared between each other for the similar period. Here exists the analyze of posts by various criterions:
Words
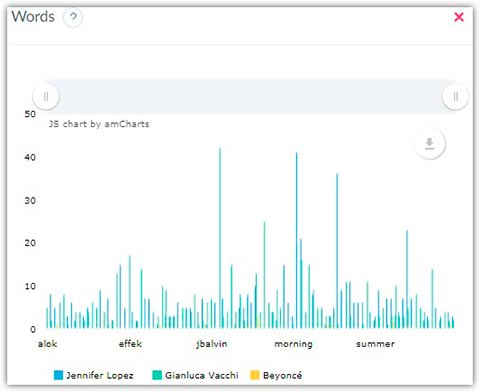
I told about them earlier. Those are charts for Text referring.
Words/ER
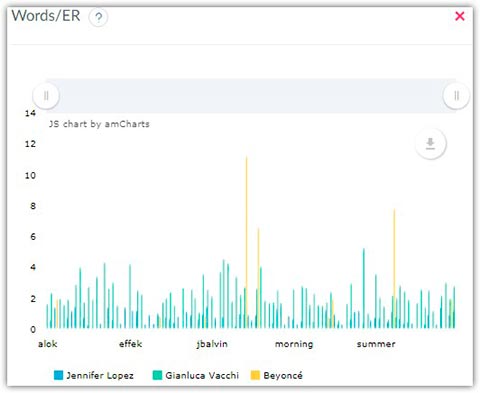
Then you see analyze of posts by:
Days of week
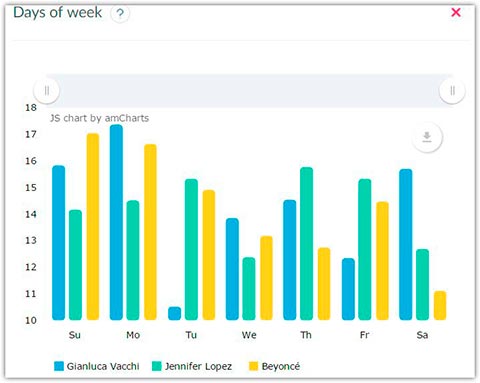
The average relative activity of one average post in one or another day of the week. A very revealing metric which expanding Facebook account statistics. Time zone is the same as the settings in that social network. All calculations have been carried out at your time zone.
Time of day
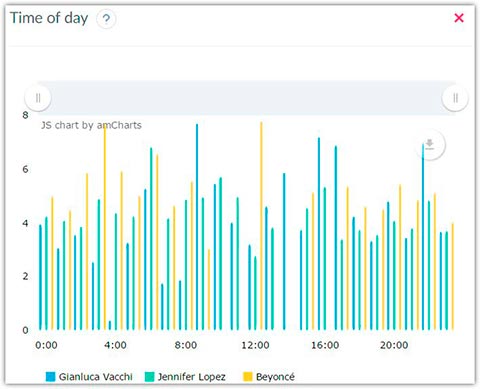
The average relative activity of one average post in one or another hour of the day. Time zone is the same as the settings in that social network.
ER post by days of week/ Text length
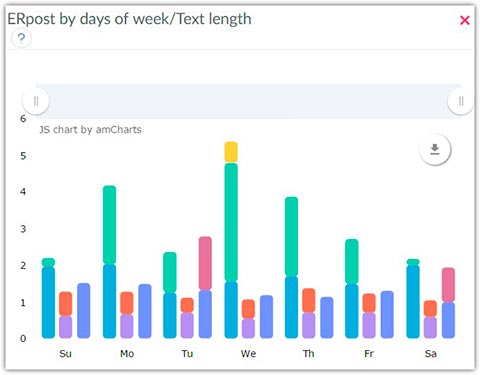
The average ER post of one average post with text certain length published in one or another day of the week.
ER post by time of day/Text length
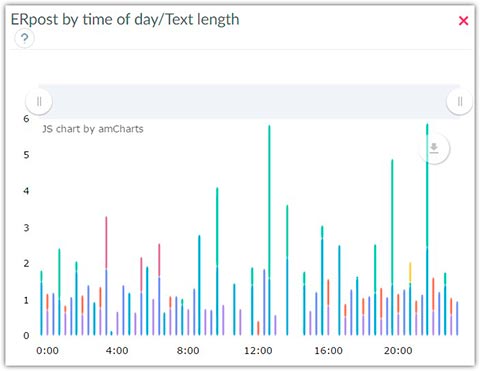
The average ER post of one average post with text certain length published in one or another hour of the day.
Relative activity by days of week/Text length
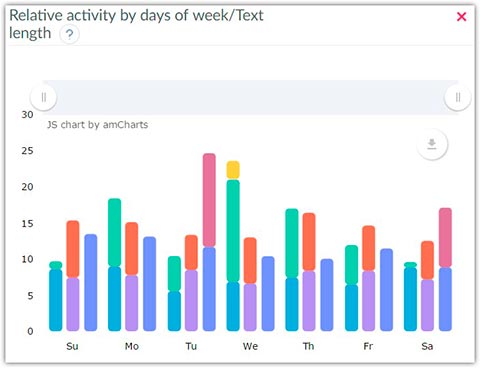
The average relative activity of one average post with text certain length in one or another day of the week. By the way, very interesting Facebook stats for social media marketers.
Relative activity by time of day/Text length
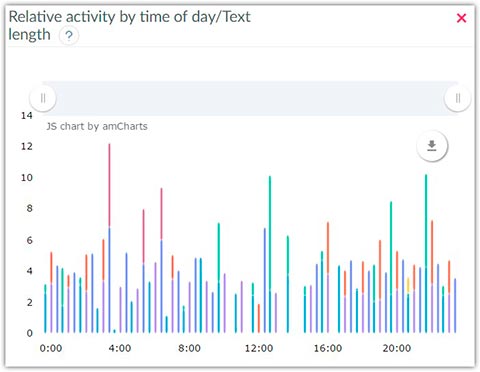
The average relative activity of one average post with text certain length in one or another hour of the day.
Likes
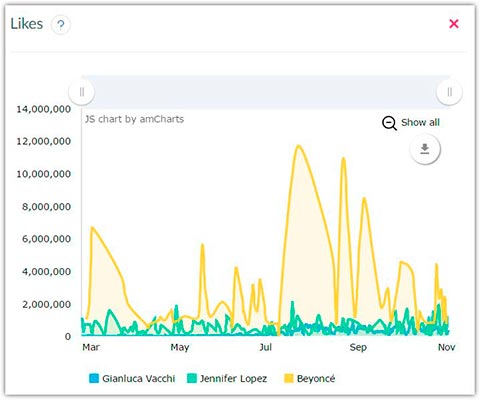
Comparison of accounts by “likes”. It is clearly in the dynamics.
Comments
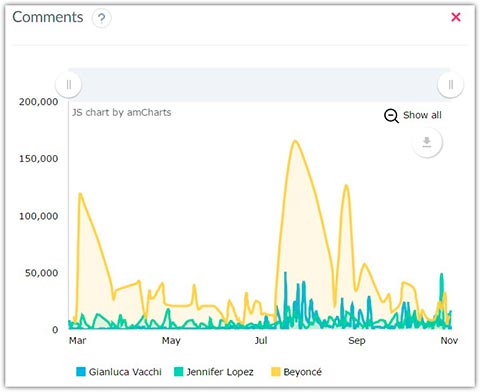
The total number of comments all published posts on a certain day.
Er (engagement rate)
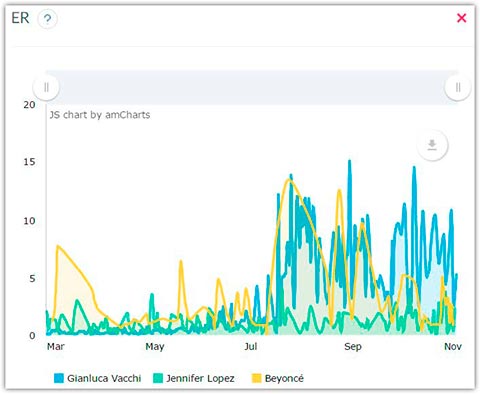
Total ER of all published posts on a certain day.
By posts publications
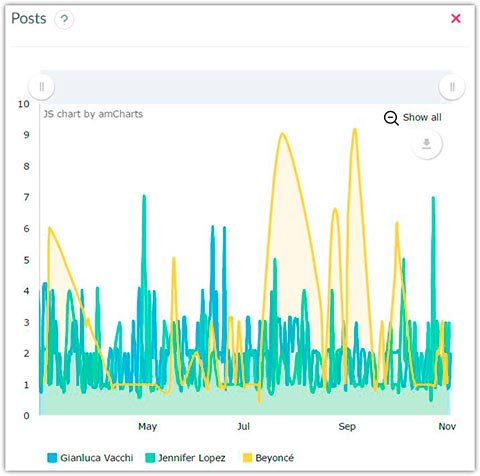
The total number of posts on a certain day.
ER post by type of content
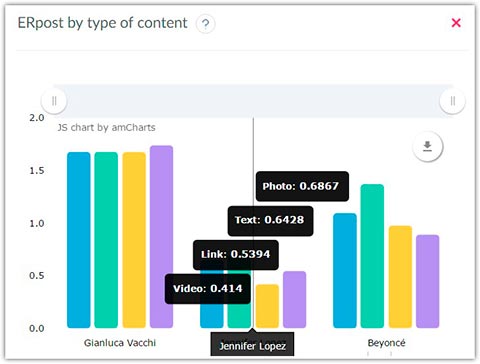
And below is the info about average ER of the posts of posts with different types of attachments. It is useful to know which type of content is preferred by followers.
Hashtags/ER
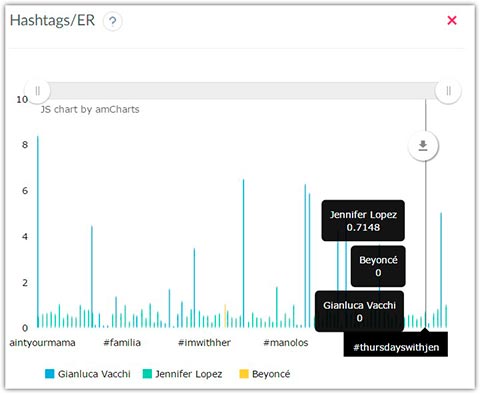
The average ER post of posts with a certain hashtag.
And few other useful graphs with stats for Facebook
Previously this stats for Facebook was inaccessible to everyone who wanted to know it. These metrics have been added recently. And now you can use it.
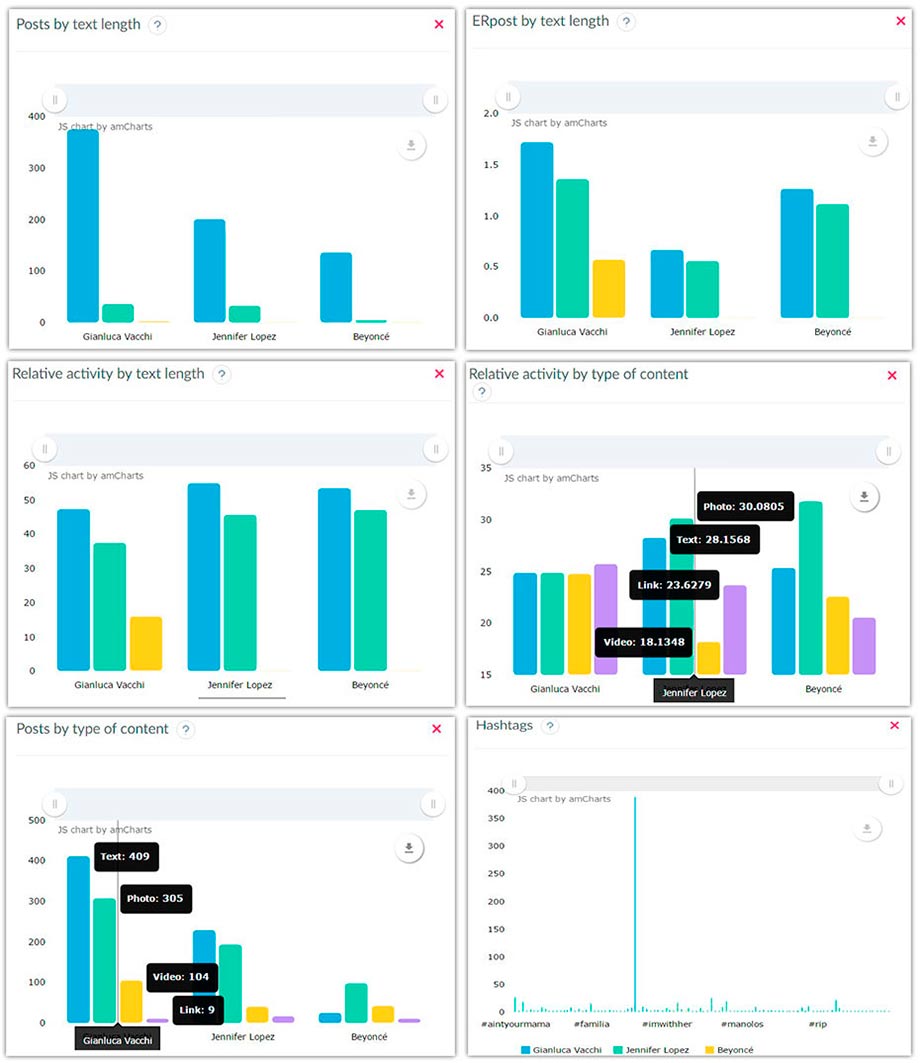
ER post by text length: The average ER post of posts with text certain length.
Posts by text length: The total number of posts with text certain length. Different types of attachments in a one post counts as separate post.
Relative activity by text length: The average relative activity of posts with different length of text.
Relative activity by type of content: The average relative activity of posts with different types of attachments.
Posts by type of content: The total number of posts with different types of attachments. Different types of attachments in a one post counts as separate post.
Hashtags: The total number of posts with a certain hashtag.
The quantity of these charts can gradually increase.
More interesting details, you can find in this video

Another way of Facebook account analysis – Facebook Insights
Sure this tool is not the only one instrument for Facebook account analysis. The Facebook team implemented its own Reporting pages. It is called Insights. But not so many people think it is so convenient.
Despite the striking differences between the tools of the FB and Popsters, the main argument in favor of Popsters is that Facebook Insights allows you to analyze only your own pages. At the same time, Popsters works with any pages that you specify.
Anyway! We have to take into the fact that Facebook launched updated account statistics in June.
The first thing that catches your eye is, of course, how the new analyst looks. Facebook has done a good job of visuality, and now the old Facebook account stats seems to be completely outdated. By the way, if there were only 10 kinds of graphs in the old version of the statistics, then in the new version there are already 18. There will be something to analyze!
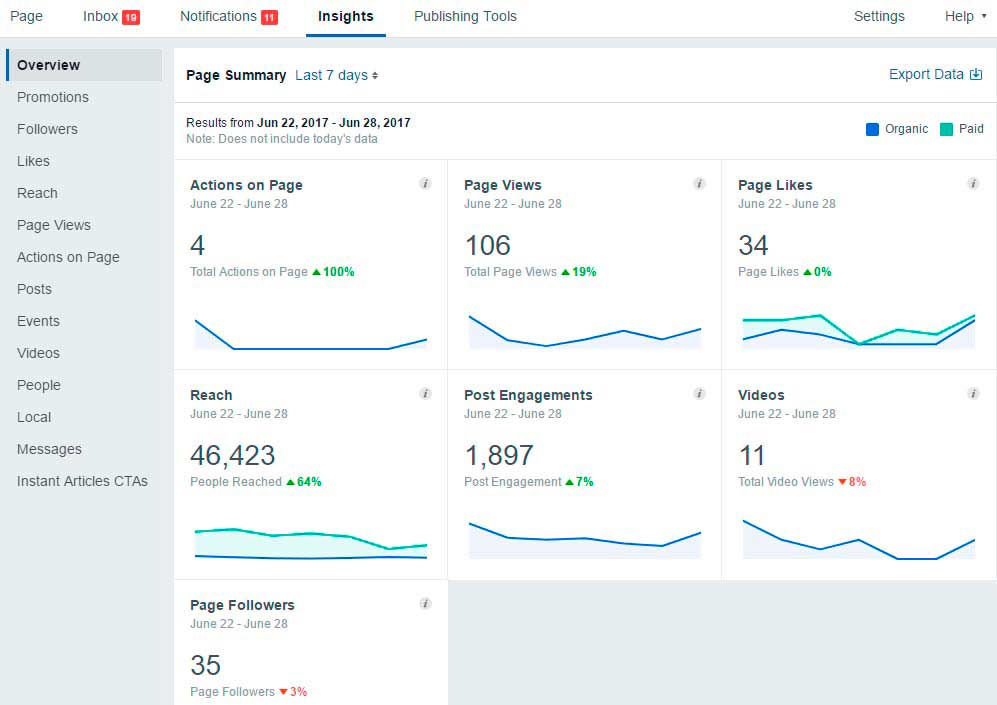
So. You can find it in the top menu in you Page.
Facebook offers such sections for review and analysis:
- Overview;
- Promotions;
- Followers;
- Likes;
- Reach;
- Page views;
- Actions on Page;
- Posts;
- Events;
- Videos;
- Messages.
Detailed instructions for using the tool you can learn here: facebook.com/help/794890670645072
Valuable Facebook Stats that will make you to be effective
- Today Facebook is the fifth-most-valuable public company in the world. Its market value is around $321 billion.
- There are over 1.94 billion active Facebook users for March 2017. And this number increased by 18% year over year. Therefore, it is foolish to stay away and not to use the tremendous opportunities that FB gives.
- There are 1.15 billion active daily mobile users (December 2016). And this figure is more by 23% than in previous year. That is a very clear illustration of how huge is role of mobile traffic on Facebook and its growth.
- There are 307 million people are on Facebook only in Europe. So Facebook is a guide to the worldwide market.
- The common age of 29,7% is between 25 to 34. This is the prime target demographic for many businesses’ marketing efforts. Do not miss the chance to engage the key customers.
- 78% of Facebook advertising revenue comes from mobile ads.
- 49% of users like a Facebook page to support a brand they like.
- 40% of users don’t like any brand pages – that means that paid ads are the only way to reach your customers.
- Videos earn the highest rate of engagement, despite only making up 3% of content. You can use this Facebook stats with advantage in drawing up the content plan.
- Mobile advertising represents 80% of Facebook’s advertising revenue.
- Posts published on Thursday and Friday receive the highest engagement. The highest traffic occurs mid-week between 1 to 3 pm. On another note, a publication at 7pm will result in more clicks on average than posting at 8pm.
- Average time spent by Facebook user is nearly 20 minutes. In this way you have only a short time period to make your impression. That’s why it is so important to make your publications relevant, interesting and unique.
Conclusion
The functionality of these tools does not intersect. Both of them have unique, useful features. And I am sure that thanks to them, you will have the complete picture about statistics on Facebook.
P.S If you really liked the article, please share it with your friends on social networks. I’ll be very grateful.
Useful article in a continuation of the topic:
- 15 most popular pages on Facebook, plus analysis of changes.
Fun video for today, acceleration on Tesla 😉

Updated on


Awesome article …
This is Inspiring me to create a better content.
Thank you for sharing this!
Jon, glad this was helpful! If you have any questions or get stuck with anything, please don’t hesitate to ask. I will try to help.